Description
This project is used for examining potential volcanic eruptions within an ice core using sulfate, particle counts, and electrical conductivity. Once tephra, or volcanic ash, has been discovered, you can use the remaining scripts to plot the raw chemical data with previously published tephra data in order to fingerprint the volcanic source. Then, the code runs a series of summary statistics and statisical analyses in order to determine the confidence of the fingerprinting results.
Usage
This code allows geochemical data saved as .csv format to be uploaded so it can be plotted and analyzed.
Dependencies
R Libraries
- tidyverse
- stringr
- matrixStats
- dplyr
- ggplot2
- plotly
- zoo
- scales
- xts
- lubridate
- rstatix
- ggpubr
- gghighlight
- geochem
- ggthemes
- dotenv
- RPostgreSQL
Sample Outputs
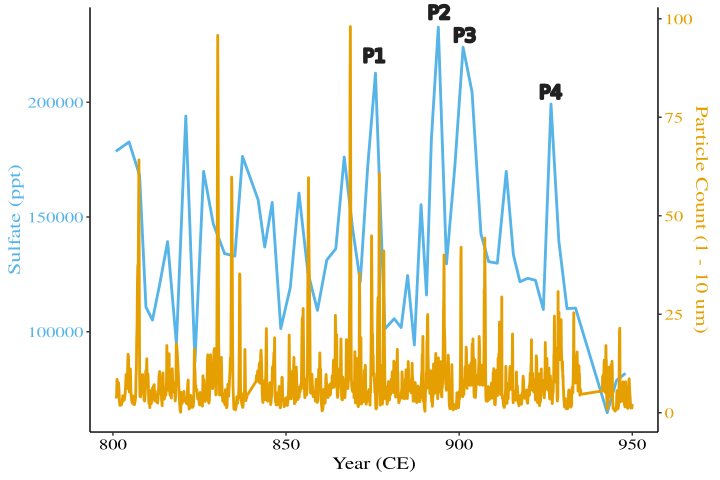
Sulfate signal (blue, in parts per trillion) with coarse and fine particle counts (yellow) for DEN-13B, showing many peaks around the time of the 852/3 CE White River Ash east eruption from Mt. Churchill. This plot was produced using the Plot_Sulfate_TotalParticles.R script.
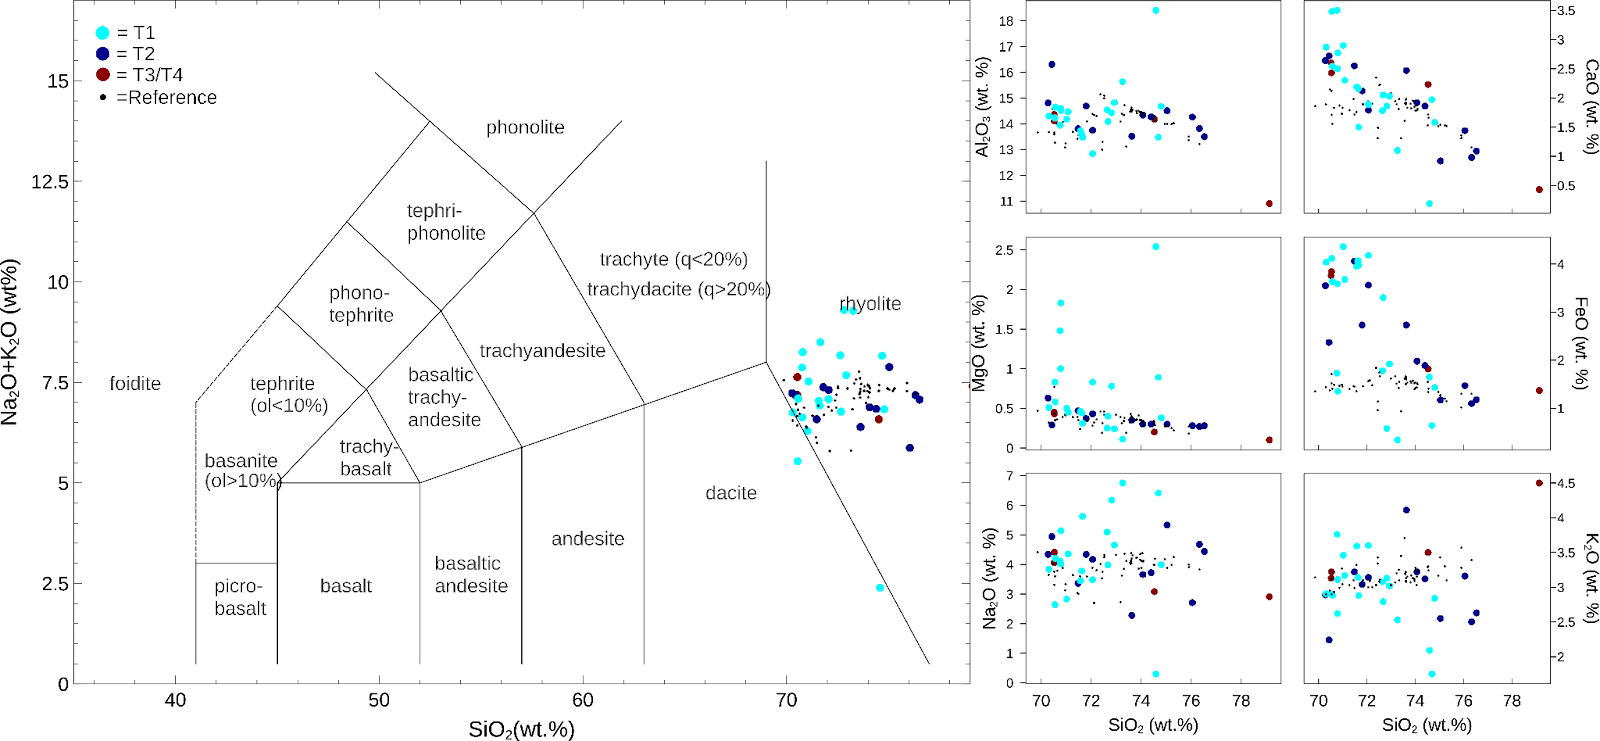
Here, the left panel is a total alkali-silica (TAS) diagram, and the right six panels are Harker (bivariate) diagrams for tephra grains analyzed on the SEM and EPMA around White River Ash east eruption. These diagrams show the general composition of all the data collected on both machines. Data from Payne et al., (2008) and Preece et al. (2014) are plotted on the diagrams as small black dots (labeled “Reference” in the legend). This plot is produced using the Plot_HarkerDiagram.R and Plot_TotalAlkaliSilica.R scripts.
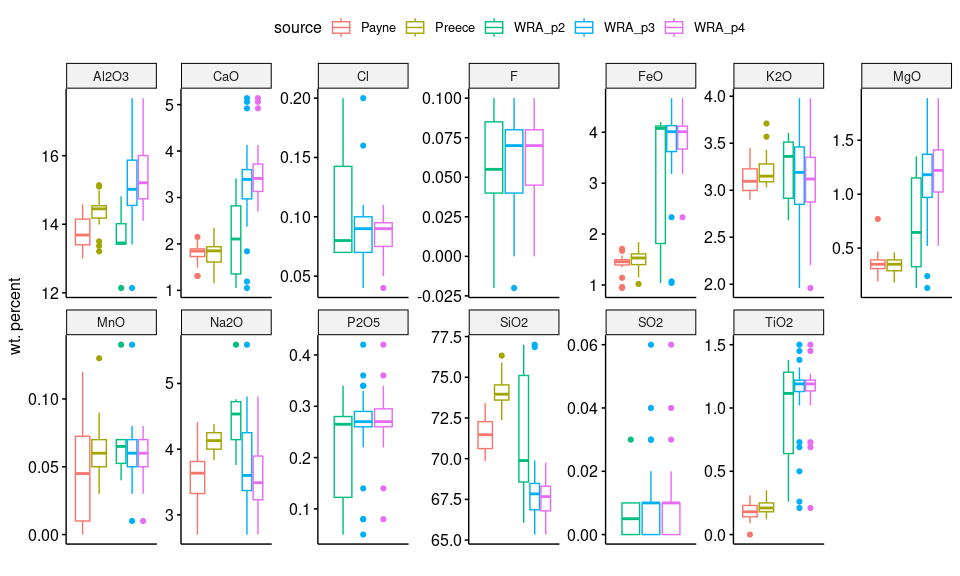
In order to understand how well discovered tephra grains correlate with known volcanic eruptive material, statistics are preformed on the data using DATA_SummaryTables2.rmd. Through this process, you will produce a single file output that contains summary statistics
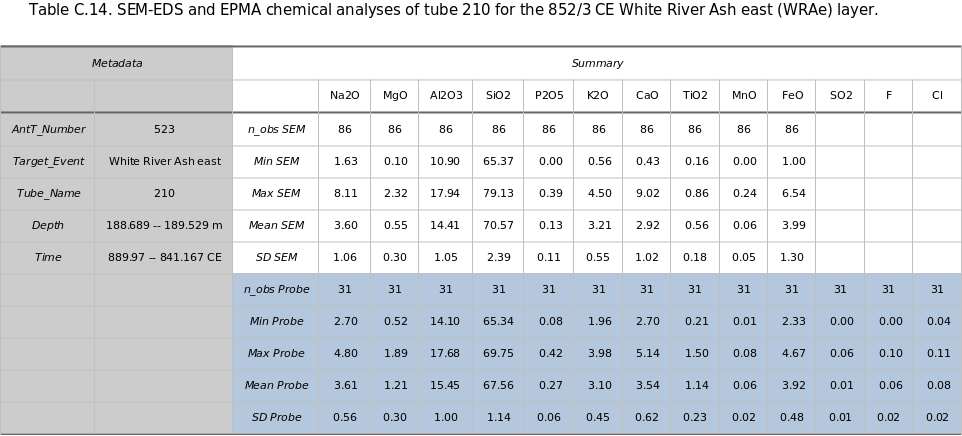
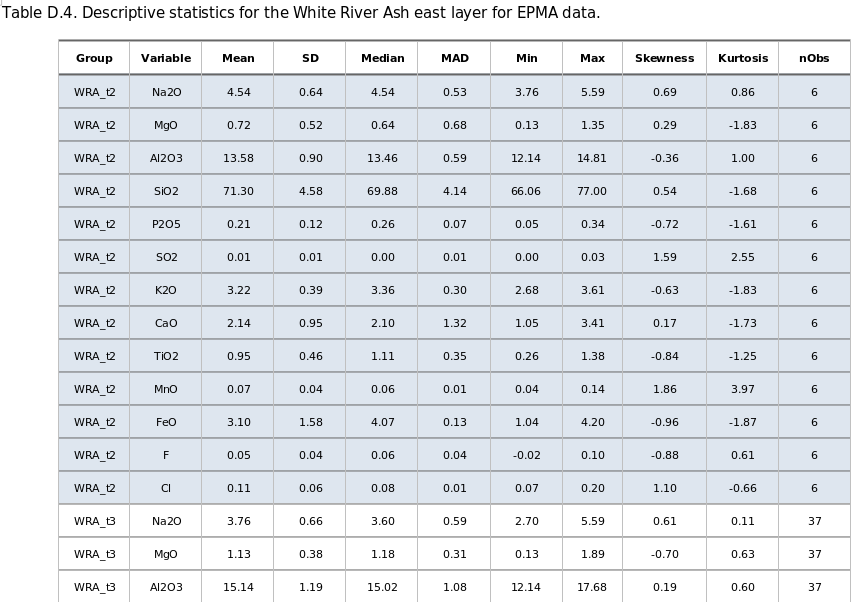
as well as box and whisker plots. These plots show the White River Ash east layer tephrochronology data plotted by oxide and colored by sulfate peak target. If available, reference data is also plotted to the left of the data from this study.